


Retiring in 15 years sounds like a date on a calendar, but the real problem is a monthly cash-flow equation. Save too little and you may reach that date with a portfolio that cannot support your spending; assume too much investment growth and the plan can look safer than it really is.
The useful question is not simply, “What percentage of my income should I save?” It is, “What retirement income gap must my investments cover, and what monthly contribution closes that gap in 180 months?” The calculations below answer that under several different assumptions.

adminEdit Profile
The Short Answer: What 15 Years Actually Requires

Suppose you have nothing invested today and make equal contributions at the end of every month for 15 years.
Under a hypothetical 7% annual return, reaching $1 million requires roughly $3,155 a month. A $500,000 goal requires about $1,577 a month, while a $1.5 million goal pushes the figure to roughly $4,732.
Those numbers change substantially when the assumed return changes. Investor.gov notes that investment returns are uncertain and that all investments carry risk, although historical U.S. stock returns are often used when constructing long-term illustrations.
Numbers at a Glance
| Portfolio in 15 Years | 5% Return | 7% Return | 9% Return |
|---|---|---|---|
| $500,000 | $1,871/mo. | $1,577/mo. | $1,321/mo. |
| $750,000 | $2,806/mo. | $2,366/mo. | $1,982/mo. |
| $1,000,000 | $3,741/mo. | $3,155/mo. | $2,643/mo. |
| $1,500,000 | $5,612/mo. | $4,732/mo. | $3,964/mo. |
These are hypothetical calculations using monthly compounding, constant returns and no taxes or investment fees. Real investment returns arrive unevenly, which means the final portfolio could be materially higher or lower.
The most important lesson is not that 7% is the “correct” return. It is that increasing the assumed return from 5% to 9% makes the required contribution for a $1 million goal appear almost $1,100 a month lower, even though you have not actually saved another dollar.
That is why aggressive assumptions can make an underfunded plan look surprisingly comfortable.
First Calculate What Your Investments Need to Replace

Starting with $1 million because it is a familiar retirement number puts the calculation backward. Begin with your expected retirement spending instead.
Estimate what you expect to spend annually, then subtract reasonably predictable income such as Social Security and a pension. The remainder is the portfolio income gap.
Someone expecting $70,000 of annual retirement spending and $40,000 from Social Security and other predictable income has roughly a $30,000 annual portfolio gap. That household does not need its investment portfolio to generate the entire $70,000.
SSA recommends using a personal Social Security account for estimates because benefits depend on your actual earnings record and claiming age. Its tools let workers compare different claiming ages and future income assumptions.
The next question is how much invested money might reasonably support the remaining spending.
Morningstar’s current retirement-income research estimates a 3.9% starting withdrawal rate for a 30-year retirement under its base-case assumptions, including fixed inflation-adjusted spending and a 90% modeled probability of funds remaining.
It is not a guarantee or a universal withdrawal rule, but it provides a useful planning benchmark.
Using 3.9% strictly as an illustration gives the following numbers.
| Annual Amount Portfolio Must Provide | Approx. Portfolio at 3.9% | Monthly Investment for 15 Years at 7% |
|---|---|---|
| $20,000 | $513,000 | $1,618 |
| $30,000 | $769,000 | $2,427 |
| $40,000 | $1.03 million | $3,236 |
| $50,000 | $1.28 million | $4,045 |
| $60,000 | $1.54 million | $4,854 |
Now the retirement goal becomes much more personal.
A household needing only $20,000 annually from investments faces very different math from one requiring $60,000. The headline may ask how much you need to invest each month, but retirement spending is what determines the answer.
There is another important distinction. If you plan to retire much earlier than traditional retirement age, your portfolio could need to last longer than the 30-year period used in that Morningstar base case, which could justify more conservative planning.
Morningstar’s recent research shows its modeled starting withdrawal rates decline for retirement periods longer than 30 years.
Your Existing Investments Can Change the Answer More Than You Expect

A reader starting from zero and a reader with $250,000 already invested should not receive anything close to the same monthly answer.
Compounding has two engines: your future contributions and the money you have already accumulated. Investor.gov’s compound-interest tools explicitly allow users to combine an initial investment, monthly contributions, investment return and time.
Consider a hypothetical $1 million target using a 7% annual return for the next 15 years.
| Current Investments | Value in 15 Years Without New Deposits* | New Monthly Investment Needed |
|---|---|---|
| $0 | $0 | $3,155 |
| $50,000 | about $142,000 | $2,706 |
| $100,000 | about $285,000 | $2,256 |
| $250,000 | about $712,000 | $908 |
*Assuming a constant hypothetical 7% annual return compounded monthly.
This is one of the biggest reasons generic “save X% of your income” advice can fail someone with a fixed 15-year deadline.
The hypothetical person with $250,000 does not need to personally deposit another $750,000. Under the stated return assumption, the existing $250,000 alone would grow to roughly $712,000, leaving a much smaller gap for future contributions.
That also explains why raiding retirement savings late in your career can be so expensive. The damage is not limited to the money withdrawn because you may also lose years of potential compounded growth.
The Inflation Mistake That Can Make $1 Million Look Bigger Than It Is
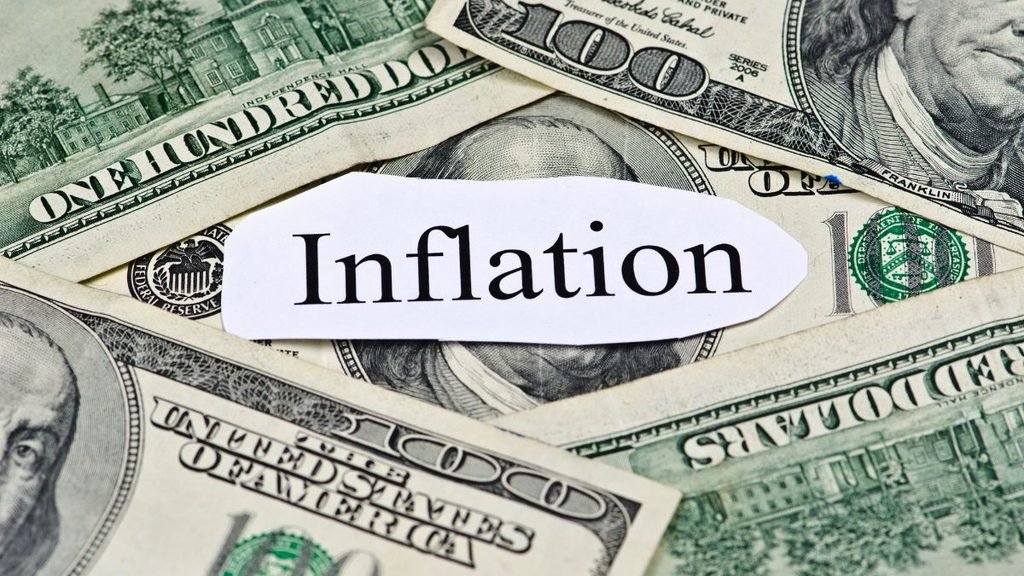
There is a subtle mistake in many retirement projections: the portfolio is shown in future dollars, but the reader mentally compares it with today’s cost of living.
Suppose inflation averaged a hypothetical 2.5% for the next 15 years. Something costing $50,000 annually today would cost roughly $72,400 a year 15 years from now if its price rose at that rate.
Likewise, $1 million received 15 years from now would have purchasing power similar to roughly $690,000 today under the same 2.5% assumption.
The Federal Reserve’s longer-run inflation objective remains 2% as measured by the PCE price index, but that is a policy objective, not a guarantee that inflation will average exactly 2% during any particular 15-year period.
There are two clean ways to handle this problem. You can project both future expenses and the portfolio in future dollars, or you can perform the entire calculation in today’s purchasing power using inflation-adjusted return assumptions.
What you should not do is mix the two.
Can You Even Put That Much Into Retirement Accounts in 2026?

For 2026, employees can defer up to $24,500 into most 401(k), 403(b) and governmental 457 plans. The IRA contribution limit is $7,500, subject to eligibility rules and taxable compensation requirements.
That means a worker younger than 50 who has access to an applicable workplace plan could potentially contribute $32,000 annually across a 401(k)-type account and IRA, or about $2,667 a month on average, before considering an employer contribution.
Compare that with our hypothetical $1 million-from-zero calculation. At a 7% assumed return, the required contribution was roughly $3,155 per month.
That leaves a gap of about $488 per month beyond those employee 401(k) and IRA limits. Depending on the person’s circumstances, additional investing might happen through other eligible tax-advantaged accounts or a taxable brokerage account.
Workers age 50 and older generally have an $8,000 workplace-plan catch-up in 2026 and a $1,100 IRA catch-up. That raises the combined potential employee contribution to roughly $3,425 per month across those two account types, assuming the person is eligible and their plan permits the contributions.
There is an even larger workplace catch-up for people who turn 60, 61, 62 or 63 during 2026. The applicable workplace catch-up can reach $11,250 instead of $8,000.
These limits matter because “just invest $4,000 a month” may require more than changing a 401(k) contribution percentage. The money may need to be spread across several account types.
Why a 15% Savings Rule May Not Work With Only 15 Years Left

Fidelity currently suggests aiming to save at least 15% of pretax income annually for retirement, including employer contributions. Vanguard uses a general guideline of roughly 12%–15%.
Those guidelines are reasonable starting points, but they do not mean 15% guarantees retirement in 15 years.
Fidelity’s guideline assumes a much longer accumulation period, including an example framework that begins around age 25 and continues to age 67. Fidelity itself notes that the appropriate savings rate changes with starting age, retirement age, existing savings and lifestyle.
Consider a hypothetical worker earning $120,000. Fifteen percent equals $18,000 annually, or $1,500 per month if we treat it as a flat monthly amount.
Starting from zero, $1,500 a month growing at a hypothetical 7% would reach roughly $475,000 after 15 years, not $1 million.
That does not mean the 15% guideline is bad. It means a percentage designed for decades of saving should not automatically be applied to a compressed deadline.
Do Not Build the Plan Around a Perfect Market Return
A spreadsheet can make investing look smooth. Markets are not.
Investor.gov emphasizes that all investments involve risk and that market values fluctuate. Returns also differ based on the types of investments you own.
That is why the earlier table used 5%, 7%, and 9% rather than pretending one return will certainly occur.
For the hypothetical $1 million target starting from zero, the required monthly contribution ranged from about $3,741 at 5% to $2,643 at 9%.
Planning around 9% because it produces a comfortable contribution is a form of assumption risk. Your savings plan becomes dependent on the market delivering the answer you need.
Investment costs deserve attention too. The SEC warns that recurring fees reduce the amount of money remaining in the portfolio to earn future returns, and even seemingly small percentage differences can produce large long-term differences.
A retirement calculator that assumes 7% after costs is meaningfully different from one assuming 7% before costs.
Four Ways to Reduce an Impossible Monthly Number

Finding out that you theoretically need $3,000 or $4,000 a month can be discouraging, especially if your household budget cannot support anything close to that.
The productive response is not to pretend a higher return will solve the problem. Change one of the variables you actually control.
First, extend the deadline. Under our same hypothetical 7% return, accumulating $1 million from zero requires about $3,155 per month over 15 years. Extending the period to 17 years reduces the figure to roughly $2,563, while 20 years lowers it to about $1,920.
Second, lower the retirement spending gap. Paying off a mortgage before retirement, choosing a lower-cost location, or reducing recurring fixed expenses can decrease the amount your portfolio must produce. The point is not to make retirement joyless but to identify expenses that permanently increase the required portfolio.
Third, increase contributions gradually. Someone unable to invest $3,000 today might start lower and route part of future raises, bonuses, paid-off debt payments, or other freed cash flow toward retirement.
A stepped contribution plan needs its own calculation because it will not produce the same result as depositing the final contribution amount for all 15 years.
Fourth, account for existing retirement income properly. Social Security, pensions, annuity income and part-time work can reduce portfolio withdrawals, but use realistic estimates rather than optimistic guesses. SSA specifically provides individualized benefit estimates based on a worker’s earnings record and claiming assumptions.
These levers can be combined. Two extra working years, a smaller spending gap and higher contributions after a car loan disappears can change the equation far more reliably than assuming unusually strong investment returns.
What People Commonly Get Wrong About Retiring in 15 Years
The most damaging mistakes are usually not arithmetic errors. They are assumptions hidden inside otherwise accurate arithmetic.
| Common Belief | Reality | Better Way to Think About It |
|---|---|---|
| “Everyone needs $1 million.” | Required savings depend heavily on spending and other retirement income. | Calculate the portfolio income gap first. |
| “A 7% return means I will earn 7% every year.” | Actual market returns vary and can include losses. | Use several return scenarios. |
| “Saving 15% means I am on track.” | That guideline often assumes decades of saving. | Compare your contribution with your specific 15-year target. |
| “$1 million in 15 years equals $1 million today.” | Inflation reduces future purchasing power. | Keep all calculations in today’s dollars or all in future dollars. |
| “Investment fees are too small to matter.” | Recurring fees reduce both current assets and future compounding. | Compare net-of-fee costs and returns. |
A good retirement plan therefore contains a range rather than one magical number. You want to know what happens if returns disappoint, inflation is higher, expenses rise, or retirement begins a few years later than originally hoped.
That approach may produce less exciting headlines, but it produces a much more useful financial decision.
Build Your Own 15-Year Retirement Number
You do not need a 50-page financial plan to get a meaningful first estimate. Five calculations can reveal whether the current path is broadly plausible and which variable deserves the most attention.
| Priority | What to Check | What to Do Next |
|---|---|---|
| 1 | Expected annual retirement spending | Estimate essential and discretionary spending separately. |
| 2 | Social Security, pension and other income | Use current personalized estimates instead of averages. |
| 3 | Current retirement investments | Include 401(k)s, IRAs and other retirement assets you expect to use. |
| 4 | Required monthly contribution | Run conservative, middle and optimistic return scenarios. |
| 5 | Account capacity and annual review | Use tax-advantaged space where appropriate and recalculate yearly. |
Start with spending because every other number depends on it. Then subtract predictable retirement income and estimate how large a portfolio must fill the remaining gap.
Next, enter your current balance instead of assuming you are starting from zero. Finally, test at least a few investment-return assumptions and see whether the required contribution fits your actual household cash flow.

Michel Nash is a Personal Finance writer focused on making money topics easier to understand and more useful in everyday life. He covers saving, investing, retirement planning, budgeting, taxes, and smart financial decisions with a clear, practical approach.
His work is designed for readers who want straightforward guidance without confusing jargon. Michel aims to turn complex financial ideas into simple, actionable insights that help people make more confident choices about their money and future.