


Compound growth has a reputation for being invisible until, suddenly, it seems to explode. That makes one question irresistible: is there an exact balance where compound growth starts to take off?
The wrong answer is a magical $100,000, $250,000, or $1 million. The right answer depends on how much you add each year and what return you assume, and using the wrong shortcut can make years of normal progress feel like failure.
This article shows the crossover formula, current retirement data, and realistic scenarios. It also explains why a bad market year can temporarily erase the feeling of acceleration.
The Exact Answer Is an Equation, Not a Magic Number

Compounding starts working with the first dollar of return. But there is a useful mathematical point when it begins doing more of the annual work than your new contributions.
Call your invested balance B, the amount added each year C, and your assumed annual return r. The crossover is:
B = C ÷ r
Suppose you invest $12,000 per year and use an 8% return for an illustration. Divide $12,000 by 0.08 and the crossover balance is $150,000.
At $100,000, an 8% year would produce $8,000 while you add $12,000. At $150,000, the two are equal at $12,000 each, while at $300,000 the same 8% equals $24,000.
That is the closest thing to an exact moment when compound growth “takes off.” It is an expected-return crossover, however, not a promise that the market will hand you that return every calendar year.
Current retirement data also gives useful context. Vanguard’s 2026 report covers year-end 2025 workplace retirement accounts, while its current market forecast is based on conditions as of June 30, 2026.
| Financial Metric | Current Figure | Why It Matters |
|---|---|---|
| Vanguard median DC balance, 2025 | $44,115 | Represents the midpoint of Vanguard participants |
| Vanguard average DC balance, 2025 | $167,970 | Pulled upward by larger accounts |
| Average total contribution rate | 12.1%* | Includes participant and employer contributions |
| Participants with $250,000+ | 18% | Shows larger balances remain a minority |
| Vanguard 10-year U.S. equity forecast | 4.2%–6.2% | Much lower than simply assuming historical 10% |
| U.S. stock arithmetic average, 1928–2025 | 11.85% | Historical result, not a future guarantee |
*Vanguard identifies the 2025 contribution-rate figure as estimated. The account-balance and distribution figures come from Vanguard’s 2026 workplace retirement research, while the market forecast is current as of June 30, 2026.
The takeaway is already visible. A $250,000 balance might represent the crossover for one investor, while another investor could cross below $100,000 or not until nearly $500,000.
Why $100,000 Feels So Important

The first $100,000 has become one of personal finance’s favorite milestones. Even Charlie Munger’s often-repeated comments were primarily about how difficult it is to accumulate that first large pool of capital from a standing start, rather than declaring $100,000 a law of mathematics.
And $100,000 unquestionably feels different from $10,000. An 8% gain on $10,000 is only $800, while the same percentage on $100,000 is $8,000.
But suppose you are contributing $1,000 a month, or $12,000 per year. Even at an 8% assumption, your own contributions are still larger than the expected growth at $100,000.
Use the midpoint of Vanguard’s current 4.2%–6.2% 10-year U.S. equity projection instead, and the contrast becomes larger. A 5.2% return on $100,000 is about $5,200, less than half the $12,000 being added by our hypothetical saver.
So $100,000 can be a meaningful psychological milestone without being a universal financial crossover.
Your Crossover Point Changes With How Much You Save
Vanguard currently projects annualized U.S. equity returns of roughly 4.2% to 6.2% over the next 10 years, based on its June 30, 2026 modeling. Vanguard explicitly says those projections are hypothetical, can change, and are not guarantees.
Using that range produces very different crossover balances. The 5.2% column below is simply the midpoint of Vanguard’s published range, not a separate Vanguard forecast.
| Annual New Contributions | At 4.2% | At 5.2% | At 6.2% |
|---|---|---|---|
| $6,000 | $143,000 | $115,000 | $97,000 |
| $12,000 | $286,000 | $231,000 | $194,000 |
| $20,000 | $476,000 | $385,000 | $323,000 |
| $30,000 | $714,000 | $577,000 | $484,000 |
This creates a counterintuitive result. Saving more pushes your crossover balance higher, because your investments must generate more money before market growth exceeds your contributions.
That does not make aggressive saving worse. Someone contributing $20,000 annually may build wealth much faster than someone contributing $6,000 even though the smaller saver technically reaches the crossover at a lower balance.
The crossover therefore is not a score. It is simply a way to understand which force is currently adding more dollars to your account.
What the Slow Years Actually Look Like
To make the curve visible, consider a hypothetical investor starting from zero and investing $500 at the end of every month. For this illustration, assume an 8% nominal annual return compounded monthly, with no taxes or investment fees.
Investor.gov notes that 7% to 10% is sometimes used as a historical long-term estimate for diversified U.S. stocks. Vanguard’s current forward estimate is considerably lower, so the 8% example below is a demonstration of compounding, not a prediction.
| Years Investing | Total Contributions | Ending Balance | Investment Growth |
|---|---|---|---|
| 5 | $30,000 | $36,738 | $6,738 |
| 10 | $60,000 | $91,473 | $31,473 |
| 15 | $90,000 | $173,019 | $83,019 |
| 20 | $120,000 | $294,510 | $174,510 |
| 25 | $150,000 | $475,513 | $325,513 |
| 30 | $180,000 | $745,180 | $565,180 |
The first decade is exactly why compounding can feel disappointing. The investor contributed $60,000 personally, while roughly $31,000 came from modeled investment growth.
By year 30, the situation has reversed dramatically. Only $180,000 was deposited, while roughly $565,000 of the hypothetical ending balance came from growth.
There are actually two different crossover moments hiding here. Expected annual growth becomes larger than the $6,000 annual contribution around year 10 under these assumptions, while cumulative investment growth does not overtake cumulative contributions until roughly the 190th month, just under 16 years.
That difference matters. Someone asking “When does compounding take over?” may unknowingly be asking two completely different questions.
The First Doubling Does Not Actually Take Longer

One popular explanation says the first doubling takes the longest and later doublings happen faster. That feels true emotionally, but it is not mathematically true if the return stays constant and no additional money is added.
At a constant 10%, the exact doubling time is roughly 7.27 years. That means $80,000 becoming $160,000 takes about the same time as $640,000 becoming $1.28 million.
What changes is the number of dollars created. The first doubling adds $80,000, while the later doubling adds $640,000.
Investor.gov’s Rule of 72 provides a quick approximation: divide 72 by the expected rate. At 10%, that gives roughly 7.2 years; at 8%, about nine years.
That is where the apparent explosion comes from. The percentage growth is not speeding up; the same percentage is being applied to a much larger pile of money.
Regular contributions complicate the picture because the saver keeps adding fresh principal. But the underlying compounding rule remains the same.
Why Our Brains Misread Compound Growth

The lily-pad riddle captures the intuition nicely. If a patch doubles every day and completely covers a pond on day 30, the pond was only half covered on day 29 and one-quarter covered on day 28.
Investment markets are not lily pads because returns do not arrive in predictable daily doublings. But the difficulty people have visualizing exponential growth is supported by behavioral-finance research.
Researchers call it exponential-growth bias. People commonly underestimate future values because they intuitively convert exponential growth into something closer to a straight line.
Stango and Zinman found that stronger exponential-growth bias was associated with more borrowing and less saving, even after accounting for other household characteristics. Later experimental work found that understanding compound-interest formulas can reduce some of these errors.
That provides a better explanation than saying the human brain simply cannot understand compounding. We can understand it, but the early portion of the curve is easy to underestimate without calculations.
What Current 401(k) Numbers Really Tell Us

Vanguard’s How America Saves 2026 reports a median account balance of $44,115 and an average of $167,970 for participants at year-end 2025. It also reports that 18% of participants had at least $250,000.
Those figures make the slow early phase easy to understand. At an illustrative 5.2% annual return, $44,115 would generate only about $2,300 of growth in a year, while $250,000 would generate roughly $13,000.
But there is an important statistical trap. The $44,115 median is not the median lifetime retirement wealth of every American.
Vanguard explains that workplace defined-contribution accounts are not closed systems. People change jobs, roll assets into IRAs or new plans, leave money with former employers, and sometimes take distributions, so a current employer-plan balance can represent only part of someone’s retirement assets.
The report also shows a median participant tenure of six years. That does not prove people typically “quit investing after six years”; it measures tenure within the Vanguard-recordkept plan and can be affected by employment changes.
Several popular compound-growth claims become clearer once those distinctions are made.
| Common Belief | Reality | Better Way to Think About It |
|---|---|---|
| “Compounding starts at $100,000.” | Compounding begins immediately. | $100,000 merely makes percentage returns more visible. |
| “$250,000 is the magic crossover.” | It depends on contributions and assumed return. | Calculate annual contributions ÷ expected return. |
| “The first doubling takes longest.” | Equal percentage returns produce equal doubling times. | Later doublings add more dollars, not faster percentages. |
| “Stocks historically return 10% every year.” | Annual returns vary enormously, including losses. | Treat long-run averages as averages, not yearly payments. |
| “The median 401(k) balance shows total retirement wealth.” | Current-plan balances can exclude other plans and IRAs. | Use all retirement assets when measuring personal progress. |
The Market Will Not Give You a Smooth Exponential Curve

The clean calculators create one problem: real markets look nothing like the smooth line they draw.
Damodaran’s NYU Stern data show an arithmetic average annual U.S. stock return of 11.85% from 1928 through 2025, with 26 negative years out of 98. The worst calendar year in that series was 1931 at negative 43.84%.
The same dataset shows $100 invested at the beginning of 1928 growing to roughly $1.16 million by the end of 2025 with dividends included. That works out to a compounded annual growth rate of about 10.0%, which is lower than the 11.85% arithmetic average because volatility matters.
That distinction is often missed. Averaging yearly percentages and measuring the return actually required to compound from the starting value to the ending value are not the same calculation.
The 2000s provide an even stronger warning against expecting a smooth “takeoff.” Using Damodaran’s total-return series, an investment covering calendar years 2000 through 2009 produced roughly negative 0.95% annualized, despite large positive years inside that decade.
A saver living through that period could watch years of contributions pile up while the market appeared to do very little. That would not mean compound growth had stopped existing; it would mean the sequence of actual returns was very different from a calculator’s constant-return assumption.
Vanguard’s current 4.2%–6.2% 10-year forecast reinforces the same lesson. Historical 10% results should not quietly become an assumed guaranteed return for the next decade.
Inflation Makes the Nominal Explosion Look Bigger
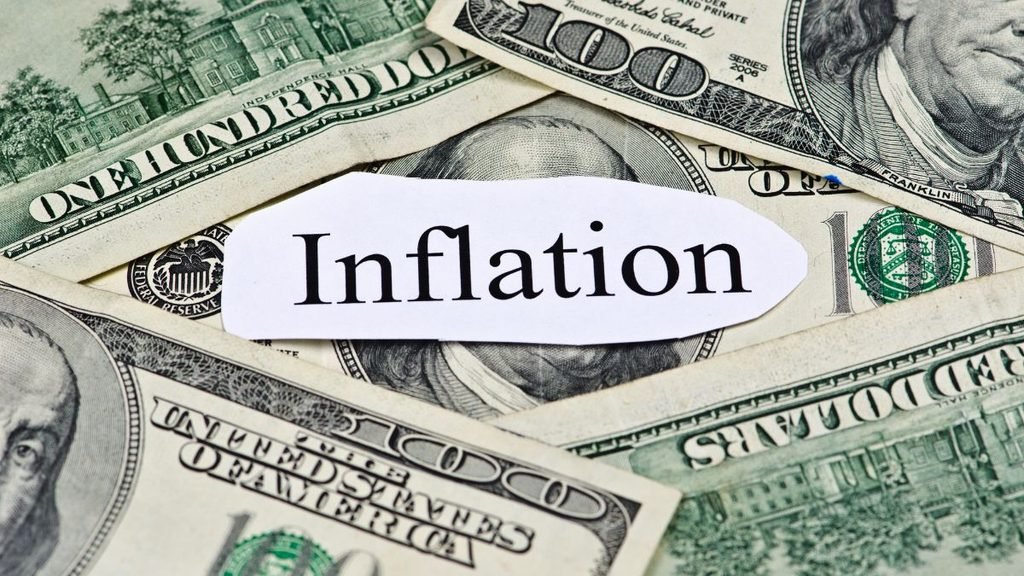
There is another reason the million-dollar numbers can mislead. Compounding in nominal dollars does not tell you how much those dollars will buy.
Investor.gov defines real return as investment return after accounting for inflation and taxes. Inflation reduces purchasing power, so nominal portfolio growth and growth in living standards are not identical.
Consider a purely hypothetical 8% investment return with 3% inflation. The mathematically correct real return is about 4.85%, calculated as 1.08 ÷ 1.03 minus 1.
Nominal money would double in roughly nine years at 8%. Purchasing power growing at about 4.85%, however, would take roughly 14.6 years to double.
That does not make compounding less useful. It simply means a future $1 million should not automatically be compared with what $1 million can buy today.
Do Not Try to Reach the Crossover by Taking More Risk
Knowing the formula creates a possible temptation. If higher returns lower the required crossover balance, why not invest more aggressively until the math looks better?
Because the return in the denominator is an assumption, not something an investor can order from a menu. Higher expected returns generally come with higher uncertainty and the possibility of substantial losses.
The SEC emphasizes that appropriate asset allocation depends on time horizon and risk tolerance, while diversification can reduce portfolio-specific risks without guaranteeing against losses.
The more useful approach is to improve the factors you can control. Contributions, diversification, fees, time invested, tax efficiency, and avoiding unnecessary withdrawals are much more dependable levers than trying to manufacture a higher annual return.
Here is a practical way to use the crossover idea without turning it into another arbitrary financial target.
| Priority | What to Check | What to Do Next |
|---|---|---|
| 1 | Total annual contributions | Include your money and employer contributions |
| 2 | Return assumption | Use a reasonable range instead of one optimistic number |
| 3 | Crossover balance | Divide annual contributions by each assumed return |
| 4 | Emergency liquidity | Keep short-term needs away from volatile investments |
| 5 | Contribution growth | Automate increases when income allows |
| 6 | Portfolio risk | Match investments to your time horizon and tolerance |
| 7 | Progress measurement | Track yearly contributions, balance, and investment gains separately |
There is an especially important lesson in step seven. During the early phase, contributions are supposed to dominate, so judging success only by investment gains makes a healthy accumulation plan look weaker than it is.
Later, the relationship can reverse. That is the point when a 5%, 7%, or 10% movement produces dollar changes that are larger than another year of saving from your paycheck.

Michel Nash is a Personal Finance writer focused on making money topics easier to understand and more useful in everyday life. He covers saving, investing, retirement planning, budgeting, taxes, and smart financial decisions with a clear, practical approach.
His work is designed for readers who want straightforward guidance without confusing jargon. Michel aims to turn complex financial ideas into simple, actionable insights that help people make more confident choices about their money and future.